1.6 Non-Gaussian phenotypes
To simulate non-Gaussian data, we can specify a link function and a family as arguments to simulate_population(). Underneath the predictors are being simulated as multivariate normal (on the latent scale), and then the resulting phenotype is transformed (onto the expected scale) and then binomial or Poisson sampling is applied (the observed scale).
Here is an example to simulate Poisson distributed data: \[ y_i \sim Poisson(\lambda_i) \] \[ \lambda_i = exp( \beta_0 + \boldsymbol{x}_{i} \boldsymbol{\beta} + \epsilon_i ) \] \[ \boldsymbol{x}_i \sim \mathcal{N}(\boldsymbol{\mu}_x, \Sigma_x) \] \[ \epsilon_i \sim \mathcal{N}(0,\sigma^2_\epsilon) \]
The only change in the code that is needed is the addition of the link and family arguments.
squid_data <- simulate_population(
  parameters = list(
    intercept = 1.75,
    observation = list(
      names = c("temperature","rainfall"),
      beta = c(0.2,0.1)
    ),
    residual = list(
      vcov = 0.2
    )
  ),
  n = 2000,
  family = "poisson",
  link = "log"
)

data <- get_population_data(squid_data)
head(data)
## y temperature rainfall residual squid_pop
## 1 7 1.3004885 0.7155515 0.06216738 1
## 2 6 1.9101220 1.3150074 -0.86303661 1
## 3 7 1.9870723 1.0214374 -0.28948062 1
## 4 2 0.3030570 -0.9352512 -0.75659522 1
## 5 11 0.6905079 0.3606059 0.23477646 1
## 6 22 1.6268158 -0.5810690 0.70292633 1plot(table(data$y), ylab="Frequency", xlab="z")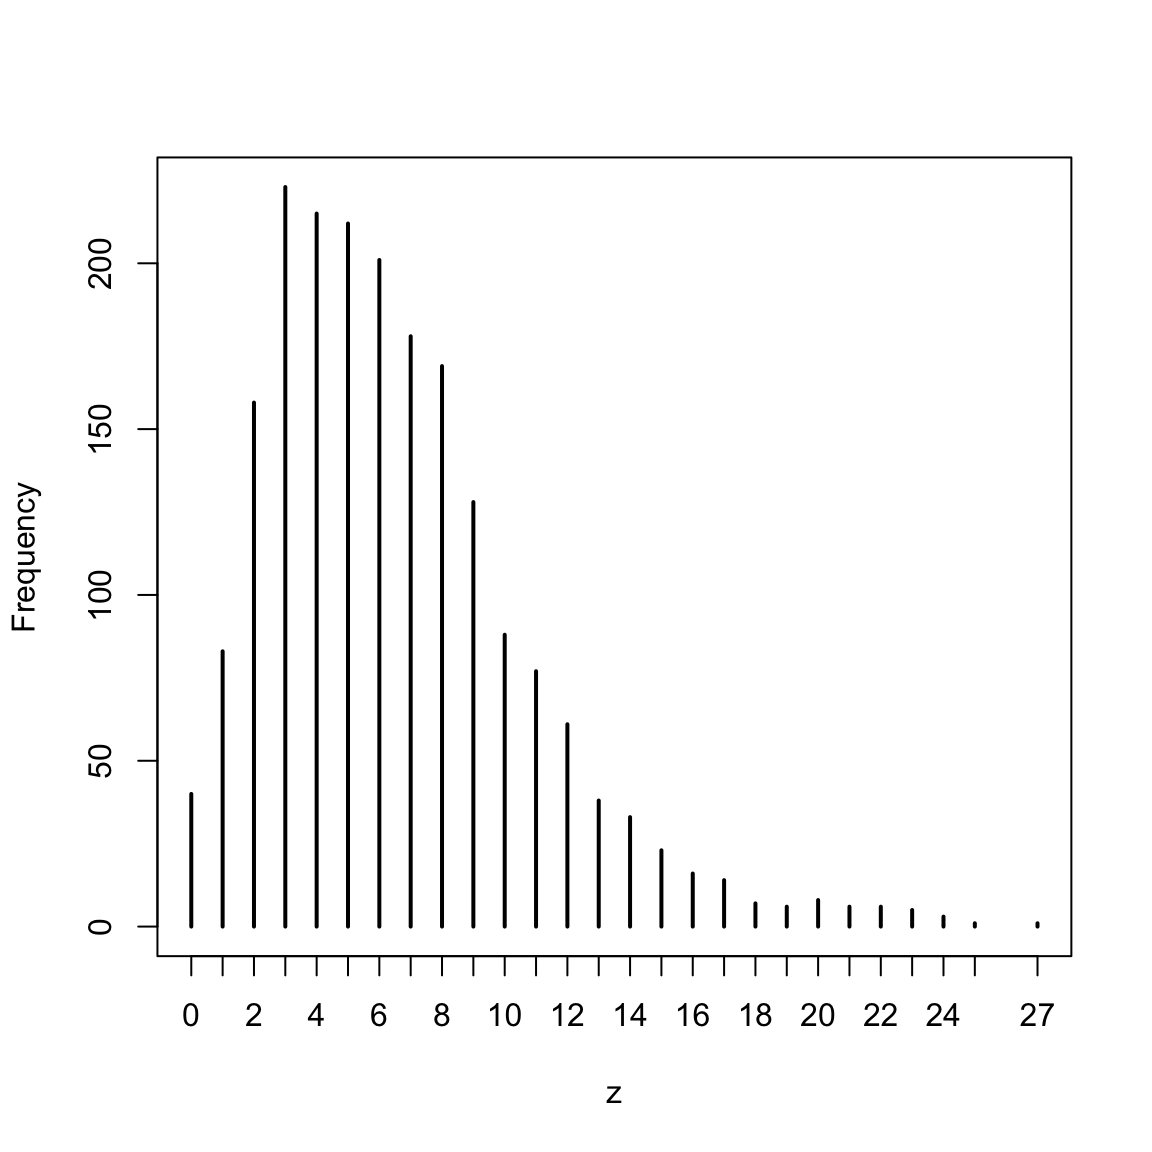
glm(y ~ temperature + rainfall, data, family="poisson")##
## Call: glm(formula = y ~ temperature + rainfall, family = "poisson",
## data = data)
##
## Coefficients:
## (Intercept) temperature rainfall
## 1.83996 0.17567 0.09701
##
## Degrees of Freedom: 1999 Total (i.e. Null); 1997 Residual
## Null Deviance: 4808
## Residual Deviance: 4290 AIC: 11320Available families are ‘gaussian’, ‘poisson’ or ‘binomial’ and link functions ‘identity’, ‘log’, ‘inverse’, ‘sqrt’, ‘logit’, ‘probit’ and ‘cloglog’.
1.6.1 Transforming across scales
It can be difficult to simulate data with a certain mean and variance on the ‘observed’ scale when using parameters on the ‘latent’ scale. {squidSim} provides two functions lat2exp() and exp2lat() that help do with the log transformation. lat2exp() transforms means and (co)variances from the latent (normal) scale to the expected (log-normal) scale, whilst exp2lat() does the reverse.
Let us take an example. We want to simulate some count data that has a mean of 6 and variance 15. In a Poisson distribution, the mean is equal to the variance. This means that a variance of 6 will be added on to the expected scale variation through the stochastic Poisson sampling process. This means that we want to simulate data on the expected scale with a variance of 9. We can use the exp2lat() function to work out the mean and variance on the latent scale that will give us what we want on the expected scale.
latent_params <- exp2lat(mean=6, cov=9)
latent_params
## $mean
## [1] 1.680188
##
## $cov
## [,1]
## [1,] 0.2231436This gives us a list of parameters with which we can simulate:
squid_data <- simulate_population(
  parameters = list(
    intercept = latent_params[["mean"]],
    residual = list(
      vcov = latent_params[["cov"]]
    )
  ),
  n = 2000,
  family = "poisson",
  link = "log"
)

data <- get_population_data(squid_data)

mean(data$y)
## [1] 5.9065var(data$y)## [1] 15.18635As you can see, we retrieve very similar values to those we were after.
We can do with with other transformation. Another one with a simple transformation across scales is the probit. The probit transformation is simply the cumulative distribution function of a normal distribution, and so we can use the functions pnorm() and qnorm() to transform between latent and expected.